NetWind Services
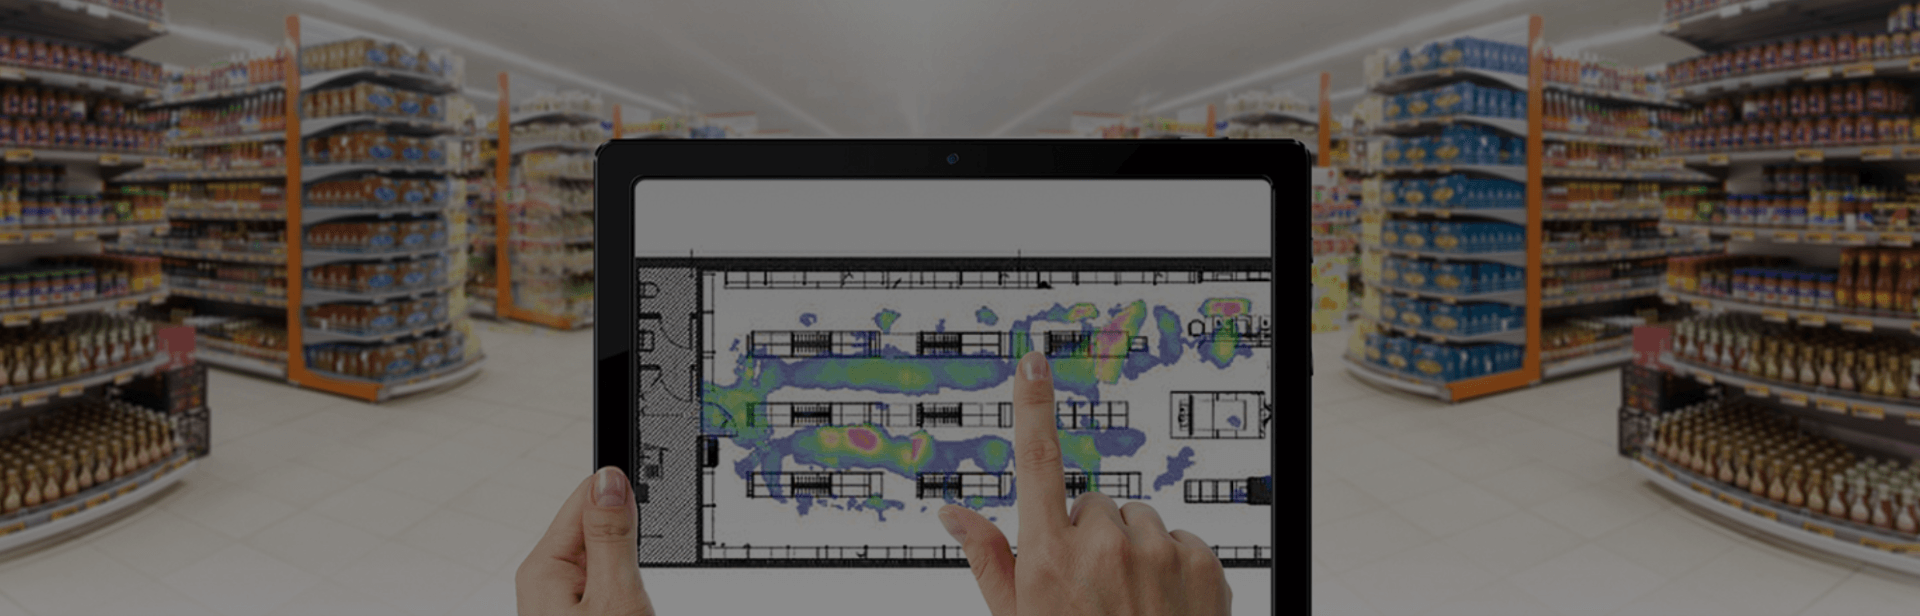
Heat Mapping
Turn customer movement into actionable insights for layout, staffing, and sales performance.
Heat mapping helps you understand how people move through a space - where they enter, where they stop, what they ignore, and which zones drive engagement. NetWind delivers heat mapping solutions that transform footfall and movement patterns into clear visual reports, enabling better decisions for retail, commercial spaces, exhibitions, and customer-facing environments.
Use heat maps to optimize store layout, product placement, queue management, and promotional effectiveness. The result is a measurable improvement in customer experience and operational efficiency - backed by data, not assumptions.
Why heat mapping matters
Heat mapping turns physical behavior into measurable signals. It helps teams improve performance across layout, operations, and marketing.
Optimize layout and flow
Identify high-traffic and low-traffic zones, reduce bottlenecks, and improve navigation through the space.
Improve conversion
Understand where customers engage and where they drop off. Use insights to adjust product placement and merchandising.
Measure campaign impact
Compare traffic before and after promotions to evaluate performance and refine future activities.

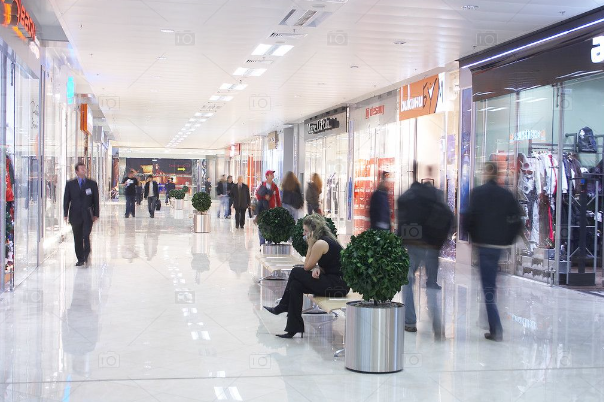
Designed for retail and customer-facing spaces
Retail performance is strongly influenced by movement patterns. Heat mapping helps you validate whether your layout supports discovery, engagement, and smooth checkout - and highlights where customers hesitate or bypass key zones.
- Entry and path analysis: understand how visitors navigate from entrance to checkout.
- Hot and cold zones: identify areas that attract attention and areas that need improvement.
- Queue and waiting time signals: reduce friction and improve service experience.
- Staffing optimization: align staff presence with peak traffic zones and hours.
The goal is simple: create a better experience while improving operational efficiency and sales outcomes.
Promotional activity analysis
Heat mapping helps you measure what matters: did a promotion increase engagement in the intended zone, or did it shift traffic elsewhere? With clear reporting, you can compare periods, test placements, and improve ROI over time.
- Before/after comparisons: evaluate changes in traffic and dwell behavior.
- Zone performance: see which areas gain attention and which remain underutilized.
- Placement testing: test alternative positions for displays and promotional materials.
- Decision-ready reporting: share insights with marketing and operations teams.
Instead of relying on intuition, you gain a repeatable method to improve layout decisions and campaign execution.
How it works
NetWind supports the full implementation - from planning and installation to reporting workflows. We align the solution with your space, your objectives, and your operational rhythm.
Assessment and setup
We define zones, coverage, and reporting needs, then implement the required infrastructure and configuration.
Dashboards and reporting
Visual heat maps and summaries that help teams act quickly - layout changes, staffing decisions, and campaign improvements.
Privacy-first approach
We design deployments with privacy in mind and help align data handling with internal requirements and applicable obligations.
Scalable deployment
Start with one location and expand to multiple sites with consistent reporting and benchmarking.